

How to measure app success? If to google the word ‘metric’ for the first time, you will find something like this: figures and statistics obtained after measuring results. In mobile application development, android app metrics are the means of finding out the app’s actual performance and whether the newly-released app will be successful in the market and get users interested from head to toe. And this method of mobile app analytics is an outstanding one!


- What’s Mobile App Metrics and Why Do We Need It?
- Mobile App Engagement Metrics and Activation Rate
- Mobile App Performance Metrics for Estimation
- App low speed
- App latency
- Crashes, glitches, bugs, flaws in UX
- Mobile App User Engagement Metrics
- Download rate
- User activity
- Active app usage time
- User retention
- Churn rate
- User Satisfaction Metrics
- App reviews and ratings
- Sign-up options
- In-app feedback
- User Acquisition Metrics
- Viral consumer attribution
- Conversion rate
- Lifetime value
- Consider Inoxoft Your Trusted Partner
- To Wrap Up
What’s Mobile App Metrics and Why Do We Need It?
The number of smartphone consumers grows with each day and now it reaches 3 billion users all around the globe. Needless to say, every mobile app development company is interested in releasing mobile apps for these fast-growing tech-savvy daily active users. Besides, every application has its average user. For this reason, companies always attempt to initiate post-release smartphone app engagement metrics.
The process of extracting valuable information is tiresome but, in the end, you will get retention metrics of your hard work tracking users’ new downloads. Unfortunately, you cannot track everything that concerns user engagement metrics, so here you have the key metrics for mobile apps to consider!
Mobile App Engagement Metrics and Activation Rate
At present, about 936 billion US dollars of smartphone app revenue is received globally. These numbers are predicted to increase within the next five years. So, developing mobile apps and releasing them is a well-thought process requiring smart decisions. As mobile app deployment takes some time when the app is released everyone thinks this stage is final and there will be no further interaction between the team of engineers and their product.
Well, not exactly. The app launch itself does not indicate that the work is done and we all can go rest. No! App maintenance and monitoring of how it works should be done on a regular basis. Nothing is perfect at its initial stage and so is the newly launched smartphone application. There can be nuances in its performance + UI/UX design that will make many users dissatisfied.
So, these nuances should be quickly tracked and eliminated as soon as possible to ensure average user satisfaction and further positive outcomes. How is it done? Surely, with the help of measuring mobile application performance metrics. This metric is a sort of vital signs check-up that will give out data on the app’s health status. And, generally, there are four basic types of mobile app success metrics that we can track and measure. These are:
- app performance metrics
- user engagement metrics
- user satisfaction metrics
- user acquisition metrics
With the help of these mobile app analytics and the results you can get from them, you will be a step closer to success. Who wouldn’t want to be ahead?

What product management metrics should you share with your external dev partner?
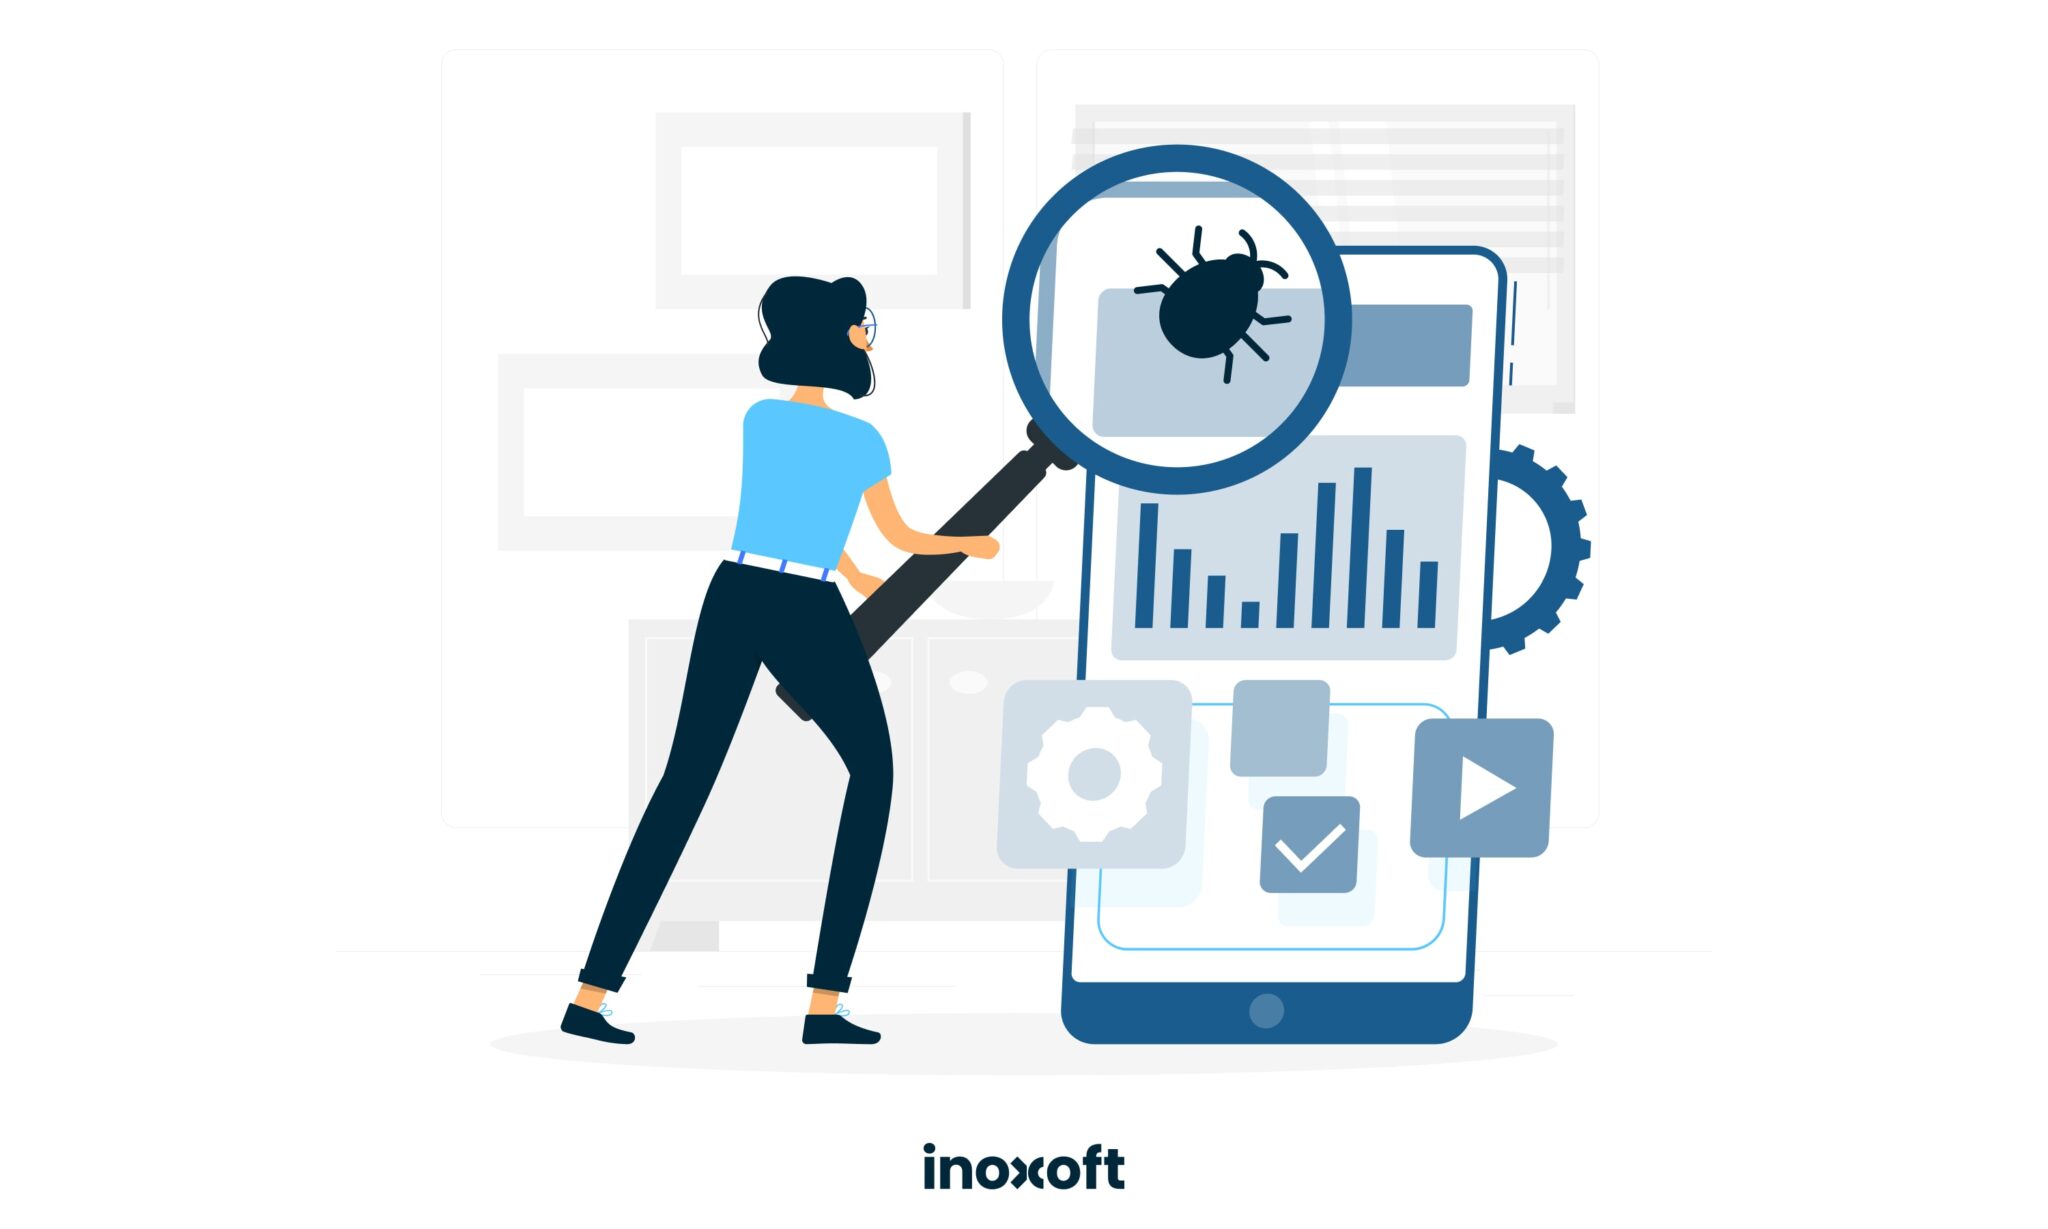
Mobile App Performance Metrics for Estimation
Performance measurement is one of the key factors that indicate the seamless work of an application. It is impossible to predict force majeure situations with the app and various troubles with its performance: i.e. low speed, unstable or lengthy loading, various unexplained crashes, glitches, app latency, errors, and so on. To ensure the app works fine, all of these issues have to be resolved with the help of app metrics. See also mobile app maintenance costs.
App low speed
Speed is an important app metric in app usage. The faster the app loads and runs, the better user engagement with it. If there are delays (data latency), the mobile app users will find this app frustrating to use, because it takes extra time to function and that can irritate many users.
App latency
App latency is the metric for figuring out the time of the request sent to the API and the received response of an app. The faster the better, of course. The only difference between app speed and app latency is that latency aims to show functional performance and speed – the loading process of an app.
Crashes, glitches, bugs, flaws in UX
A crash is the unexpected closure of an app during its usage. Most of the app crashes are eliminated at the quality assurance testing stage when it is possible to identify errors immediately and software engineers will work out how to remove them top-notch. Glitches are the temporarily distorted functioning of an app, which makes it unstable during usage. Bugs and flaws of UX are the irregularities of an app and its unmet standards. All these features state that the app will receive low user engagement and no user satisfaction at all. Thus, it is crucial to identify the weak points and improve the app performance with the newer error-free updates.
Mobile App User Engagement Metrics
User experience is one of the most important factors in user app satisfaction. If the user experience is not as positive as it should be, do you understand what it makes user satisfaction look like? For instance, if the app crashes, loads slowly glitches, falls out, or doesn’t work appropriately and your QA team did not spot those defects while testing, it is a matter of urgent concern and needs immediate improvement. Everything developed nowadays is meant to be average user-proof and the success of the mobile application depends on whether its users will love it. Hence, engagement statistics might be quickly tracked according to the download rate, user activity, active app usage time, retention rate, and churn rate.
Do you know what’s a centralized distribution system development?
Download rate
If you are an end-user and want to download an app from the app store, what is the first thing you look at? Maybe, not the first thing exactly, but it still matters to you. The number of app downloads, right? This is one of the metrics showing concrete user experience and user engagement with the app, and the tendency over some time. The more people want to download – the better is your retention! And vice versa.
The download rate is affected by the marketing strategy you’ve chosen and consumer response. If it’s quite low, then something is wrong with your promotion methods. Besides, the Google App Store and the Apple App Store are different platforms with distinctive algorithms of app store optimization, which, in their turn, make the app uploaded either top-rated or at the bottom line. Hence, you may need an app store optimization for your app. Usually, app store optimization includes the logo, the icon, the name of an app, and its size. The better your app is optimized the higher the number of new downloads. It is possible to check the download number beneath your app or with the help of Google Analytics. These are all the marketing metrics to measure.
User activity
Data about engaged and active users is quite different than the download rate. The keyword here is “active.” There are cases when users download an app but rarely use it (are passive) or never use it and then delete the app. So, it is important to understand daily active users (DAU) engagement motives concerning the app, and, then, the monthly active users (MAU) ones. Don’t worry if the numbers are not as high as you’d probably want. All you need here is to make users want to open your app and use it. You can do that with the help of push notifications and reminders. Target users’ needs, make an app based on those needs and gently push users to be more active every day.
Active app usage time
Application usage metrics investigate user engagement with the app even further. Here, it is important to understand what is the session length of the consumers and whether short or long intervals prevail in the app usage sessions. What’s more, the session length can be increased. Users tend to open apps more frequently when these apps are integrated into their day-to-day activity: e.g. emailing while working, Instagram, Facebook, Twitter for communication and leisure, the weather app, and the news app to find out what’s going on in the world, etc.
The session length is the key app metrics measurement. An app, which is open for 15 seconds (or less) and the app open for 5 minutes (or more) has a different session length and, thus, becomes statistically valuable to calculate user engagement. Here, the users are divided into daily active users (DAU) and monthly active users (MAU). For example, Facebook revealed its daily active users – 2.08 billion in 2023.
User retention
Retention rate investigates the loyalty of your potential consumers. This measurement technique shows the percentage of consumers returning to your app within 30 or 90 days. For example, in 2019 Japan’s retention rate was 5.4% in 30 days after the initial app downloads by users – the highest among the other measured countries. And China’s retention rate after the 30 post-install days was lower – only 1.5%. As you can see, it is impossible to have a 100% return rate or even half of this number, so brainstorming and creating ways for new users to make new downloads is a must.
Also, there is one more KPI measurement that belongs to retention metrics. It is called the activation rate. The specificity of the activation rate is to find out the number of visitors interacting with your app. For instance, the activation rate monitors the number of clicks via the app, time spent in the app, what was viewed or downloaded, etc. The activation rate denotes every action that leads users to retention, i.e. return to your app and engage with it.

Churn rate
Every app has two types of users: active and passive. When the active ones impact user retention and overall app health, the churn rate calculates the passive ones and it isn’t fun. The churn rate measures the number of users, who stopped using your app for any possible reasons. These metrics are the most crucial when your active users become passive and appear on the churn list. It impacts your average revenue per user pretty badly. The higher the value of your users using the app, the bigger the negative outcomes when your most active consumers become non-users. Low-engagement users never make much of an impact and, thus, we never count them. To count your app’s churn rate you should take the number of churned consumers and divide it by the total number of app users. If you are curious to find out your mobile app’s churn rate now, try to do it here!
To improve the churn rate, you should always dig deeper and find the core issue of why the users, who loved your app dearly, forgot about it and stopped using it. Here, only a survey based on user experience might help. Make great offers to consumers to make them return. To keep your churn rates low, engage your end-users, and make them love your app and use it.

User Satisfaction Metrics
User satisfaction plays a crucial role in user engagement and the final verdict for an app. User satisfaction aims to show which features are popular among the tech-savvy DAU and MAU and which are not well-thought-out. Here, you can measure app reviews and ratings, user sign-up satisfaction, and in-app feedback.
App reviews and ratings
Imagine, a consumer went to the app store and wanted to download your app for the first time. However, to the user’s greatest disappointment, your app is not on the top-searched list. And it’s a drawback. If your app happens to be at the bottom, the user will likely download the one that appears on top of the list. The higher the ranking of your app while searching for it among the similar ones, the bigger the number of app downloads it’ll receive. The higher the search rank of your app, the more discoverable it is during app store browsing. Perhaps, some of the most common app store optimization techniques might help.
What’s more, nowadays users are more prone to reading reviews from other consumers. If the app works perfectly, there shouldn’t be any bad reviews but only five stars and praises of excellence. However, we all know, stuff happens and 1 out of 10 DAUs or MAUs may have an app crash, the app may not work well on the consumer’s device and other unpredictable issues. Thus, this user will leave a bad comment at the top and put your app at risk of a low download rate. The cost per one bad comment will be high-powered as users never scroll down to read all the reviews, only some of them do, but what are the chances?
Sign-up options
Most of the DAU and MAU are eager to download a perfect app with a good rating, but boy they become disappointed when your app has a sign-up option or else – it won’t let you use it unless you sign-up. This isn’t the best idea to ask a potential consumer for some personal information as it pushes away eventually. This makes your app abandoned without even a chance of coming back. Navigation through the app shouldn’t require personal info like email or phone number, date of birth, and user’s name. If your app is an ordinary one and sign-up seems useless, don’t use these app metrics to track your users because it will only increase the churn rate.
In-app feedback
Your app users may become your greatest asset. While using the app they can be asked to give you their immediate feedback. For example, you can send push notifications with surveys. Surveys are designed to examine something formally or officially to ascertain condition, character, etc. Most of the DAU and MAU will give their feedback and answer survey questions and, this way, make a lot of difference for you. But don’t make your surveys too often or with lots of questions to think over as it pushes away the end-users. Here, you can ask about the most used app features, the so-called heat map, and ask the user to score from 1 to 10 on how much he or she is likely to recommend your app to other people. Sounds optimistic!
Learn more about KPI in software development!
User Acquisition Metrics
Your further app promotion needs to find out where your consumers are coming from. This way you will understand the successes and losses of your marketing strategy. Here, you will save money on sources that do nothing, in particular, to make users download your app. The specific formula to count your cost per acquisition is to take the number of money spent on acquisition and divide it by the number of these acquisitions.

Viral consumer attribution
Have you ever noticed something like “Invite a friend and you will get a bonus!”, especially in mobile game applications? This is one of the tactics that work to obtain new users. Also, a good app has rapid info dissemination through people talks and recommendations. It is hard to measure recommendations offline, but it is possible to make it online and count new users. And again, only satisfied users will make recommendations out of sheer interest and engagement with the app.
Conversion rate
If the mobile analytics metrics are successful it should bring you profit, right? Profit consorts with the app conversion rate. For instance, in-app purchases, monthly or yearly subscriptions at cost, and shopping carts may generate quite a solid conversion rate, but you have to optimize these processes as much as possible for the end user. Start with the app store optimization and follow with the app optimization. If there are too many clicks leading to other pages and a lot of information needed to proceed, the end-users will likely abandon your app. Your conversion funnel should be as simple as possible not to lose money and users. A conversion rate calculator that might be handy can be found here.

Lifetime value
Lifetime value (value LTV) is the sum of the average revenue per user earned before the potential consumer abandoned your app. This metric uses cost per acquisition (CPA) calculations as well. If the cost is bigger than the lifetime value (value LTV) rates, the app will likely bring you big losses. The exact needs of your users should be met to increase user attribution. Good customer service, quick responses, and attractive features of an app are the key factors that will help an app shoot out by all means. Lifetime value targets how much value an average consumer might bring to you while using the app. This profit can be analyzed before putting in marketing costs or after the costs have been applied, and ensure consistent calculations afterward.

Consider Inoxoft Your Trusted Partner
Inoxoft is a mobile app development company with more than 9 years of experience. App analytics metrics are one of the most essential parts of mobile marketing. To understand, where you stand and what your app is capable of, you should definitely gather performance analytics. And, we recommend it to our clients.
To Wrap Up
App metrics are one of the most important stages of information gathering after the app’s post-release. To ensure your app is worthy of all the downloads and consumers will install the app with lightning speed, you need to monitor your app’s vitality (among these, the average revenue per user) and meet user needs daily.
Also, it is important to eliminate errors, bugs, glitches, UX flaws, and other stuff that may lead to a churn rate. So, these are all the examples of the key mobile app metrics you should be measuring! And, I hope, nonetheless useful. With outstanding input, you will get great output, understand the key performance indicators (KPIs), and increase your company’s ROI.
Choose Inoxoft and our iOS apps development services!
Frequently Asked Questions
What is mobile app analytics metrics?
In mobile application development, metrics are the means of finding out the app’s actual performance and whether the newly-released mobile app will be successful in the market and get mobile app users interested.
What mobile app metrics you should measure?
- User engagement metrics
- App performance metrics
- User satisfaction metrics
- User acquisition metrics