
Every single second oodles of data is being produced all around the world. Most of it is raw. Have you ever wondered how this information is being processed and reaches us in a familiar form? How can unstructured data benefit your business? And which is better data science or data analytics?
Despite being interconnected, these terms pursue different approaches and provide different results. In the article, we break down both categories and discover the value they can deliver.
So, let’s deep dive and discover the difference between data science and data analytics.


- What Is Data Science?
- What does a data scientist do?
- Responsibilities for Data Scientist jobs
- Qualifications for Data Scientist Job
- What Is Data Analytics?
- What are the skills required to become a data analyst?
- How Data Help Businesses?
- Data analytics services in logistics
- Data analytics services in healthcare
- Data analytics services in fintech
- Data Science vs Analytics
- Inoxoft Experience
- Final Thoughts
What Is Data Science?
According to Harvard Business School, data science builds and organizes datasets. Experts who work in this area, create algorithms, statistical models, and analyses to collect and form unprocessed data into something that can be understandable to everyone.
What does a data scientist do?
To become a data scientist it’s required to have analytical, statistical and of course, programming skills to study, interpret data sets and then develop data-driven solutions to business needs.
Other functions may include:
- Data wrangling or data cleaning is the process of organizing raw data to a more accessible format.
- Statistical modeling is the process of running data through classification, regression, and clustering models to gain insights from the numbers.
- Programming is the process of writing computer programs and algorithms in data science programming languages (e.g. R, Python, and SQL)
- Deep Learning aims to extract complex features in the data.
The usage of data science for finance: benefits, challenges and use cases!
Responsibilities for Data Scientist jobs
- Analyze data to enable optimization and improvement of product development and business strategies within a particular company.
- Use predictive modeling to increase revenue generation, ad targeting, and customer experience.
- Monitor and analyze data accuracy.
- Develop a testing framework and test model quality.
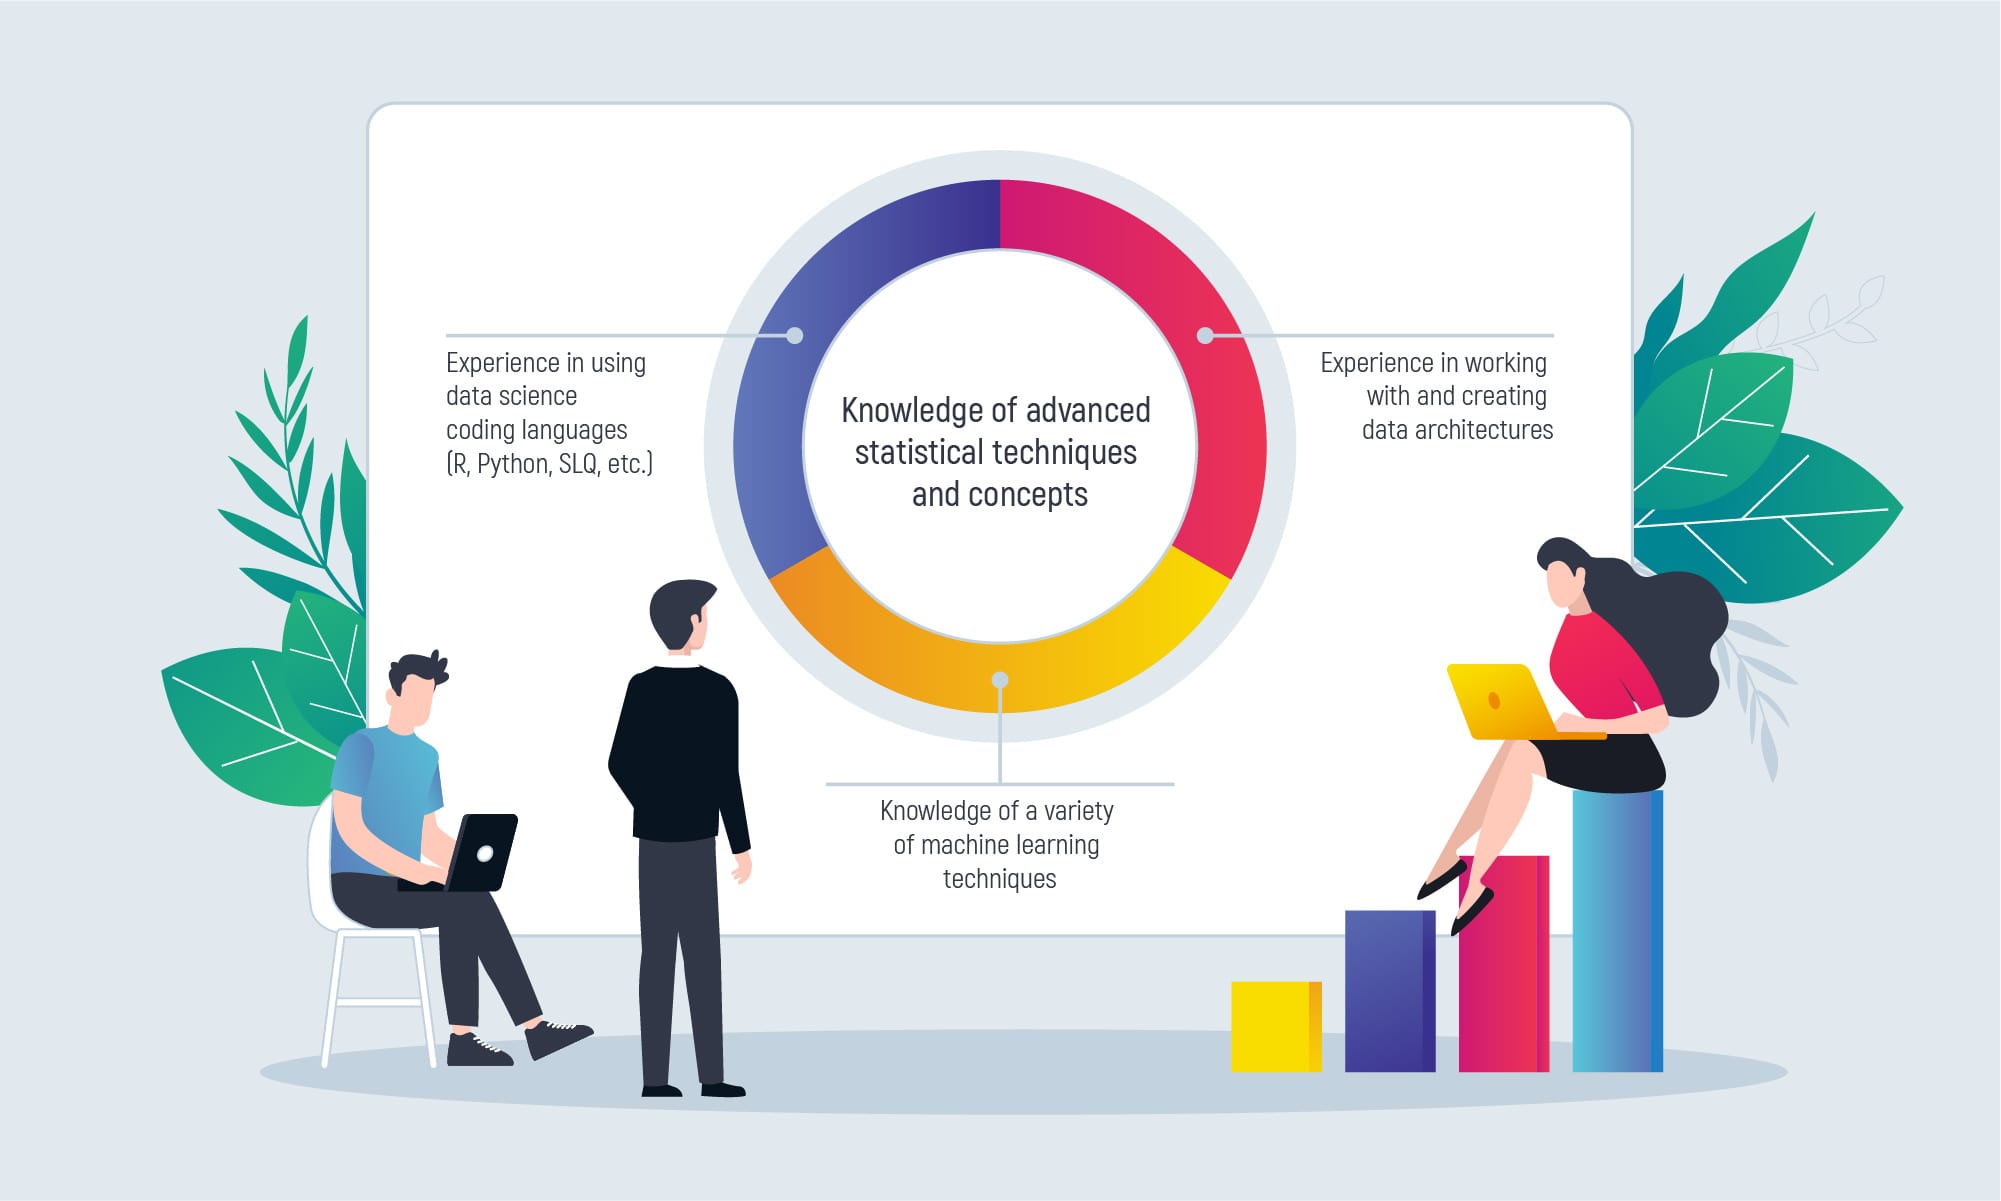
Qualifications for Data Scientist Job
What Is Data Analytics?
According to Harvard Business School, data analytics means interpreting data, understanding datasets, and gathering insights that can be transformed into solutions. Analysis conducted using tools, techniques, and frameworks depending on the types that include:
- Natural Language Processing
Analyze datasets of text to gain insights on sentiment, improve customer service, build chatbots, etc.
- Computer Vision
Replace manual work with algorithms that enable computers to leverage image recognition and to learn from previous experience.
- Marketing optimization
Forecast trends, and create a marketing plan based on customer behavior data
- Descriptive analytics
Explore, describe, and explain something that’s already happened
- Diagnostic analytics
Attempt to understand the reason behind what happened
- Predictive Modeling
Relies on past data and give hypotheses, predicts trends and risks, answer questions about what will happen in the future
- Prescriptive analytics
Identify steps that the organization has to take to reach projected goals
- Pricing analytics
Predict profitable prices and create a pricing strategy for the business
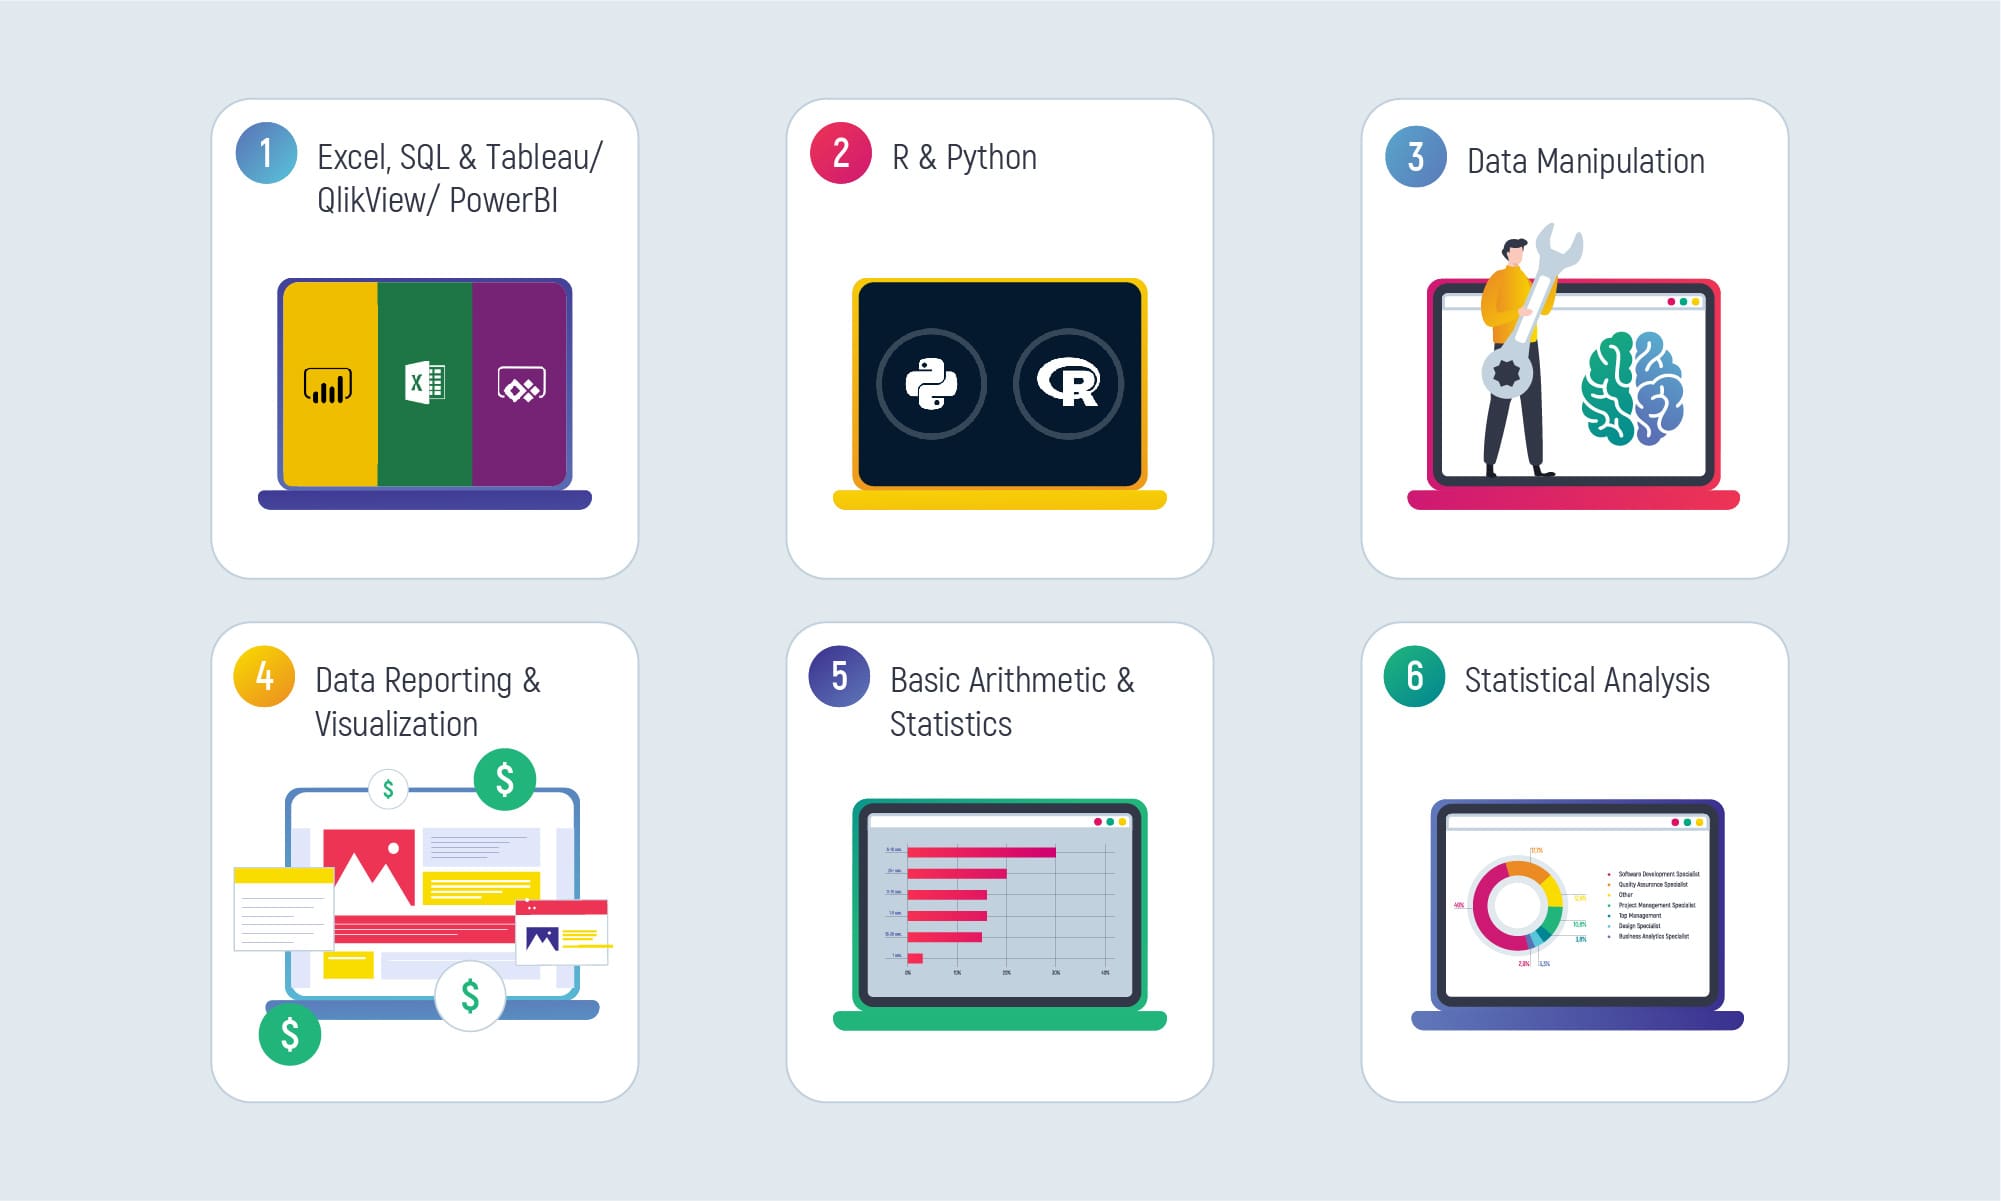
What are the skills required to become a data analyst?
How Data Help Businesses?
Businesses organize raw information coming from both external and internal sources using data analytics techniques to improve their performance, create strategies, understand their customers, evaluate campaigns, personalize content, and develop products, etc.
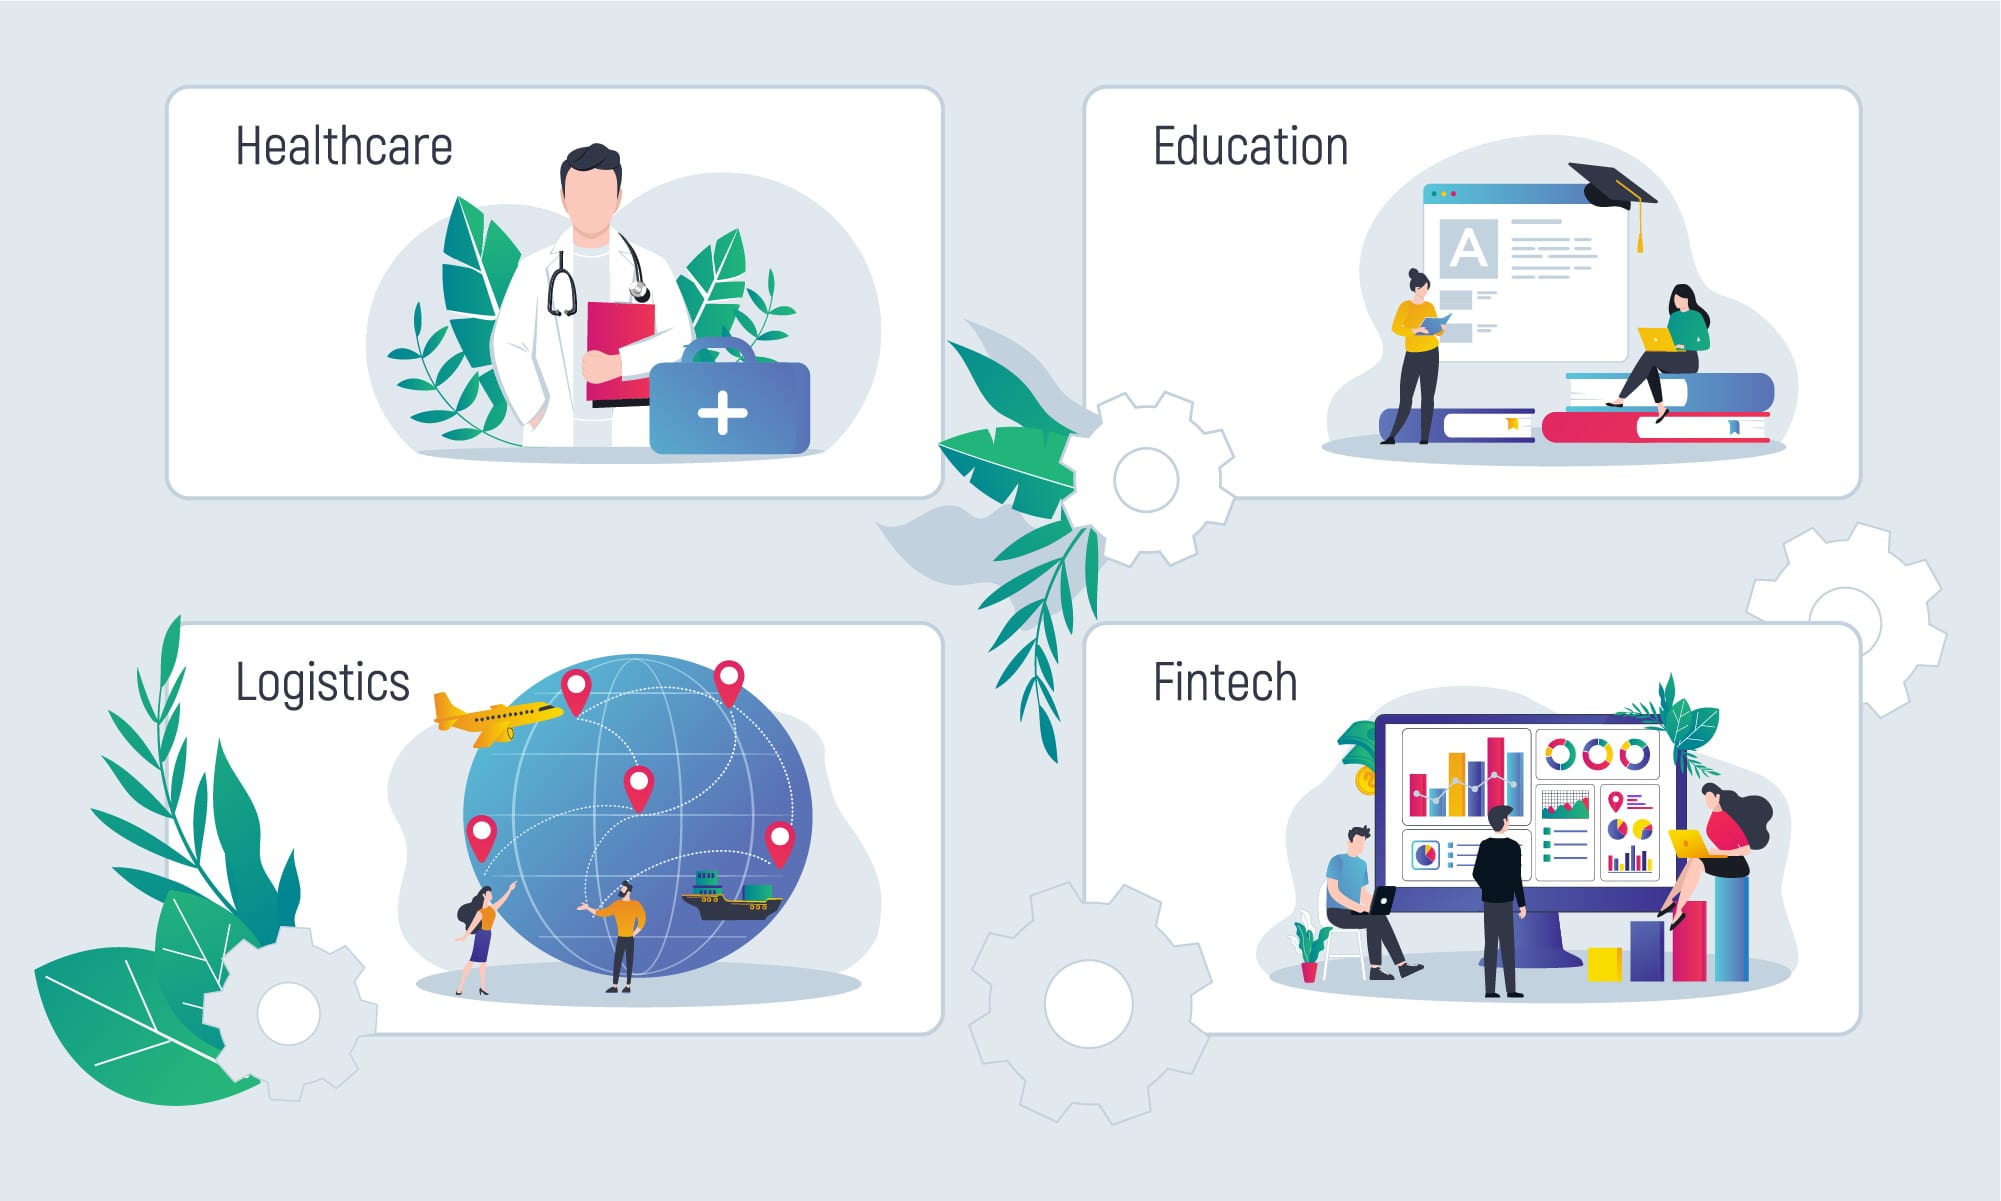
Data analytics services in logistics
Our team creates data-driven systems and supply chain management for companies in the logistics industry. With the help of this particular software companies can avoid multiple risks in delivery, boost the quality and speed of all processes. Other benefits include:
- Reduce inventory and transportation costs
- Automate manual and time-consuming processes in the supply chain
- Optimize warehouse space
- Forecast product demand, markdown, and prices
- Improve security and organization performance
Data analytics services in healthcare
By using data analytics, our team delivers top-notch solutions for medical institutions. Here it
- Use data to detect health issues
- Use patients’ medical data to provide official information to healthcare service providers
- Help doctors diagnose more accurately and start treatment faster
- Enable accurate diagnoses
- Analyze health to discover symptoms and prevent the spread of diseases
- Develop smart EHR systems
Data analytics services in fintech
Analytics methods perform fraud detection, risk evaluation, transaction records, and asset management. Also:
- Improves quality of e-learning
- Receives insights on learners performance
- Detects students behavior based on interaction with software
- Conducts text mining to evaluate students skills, self-reflection, emotions, and more
- Improves student enrollment and career direction
- Assists students via chatbots
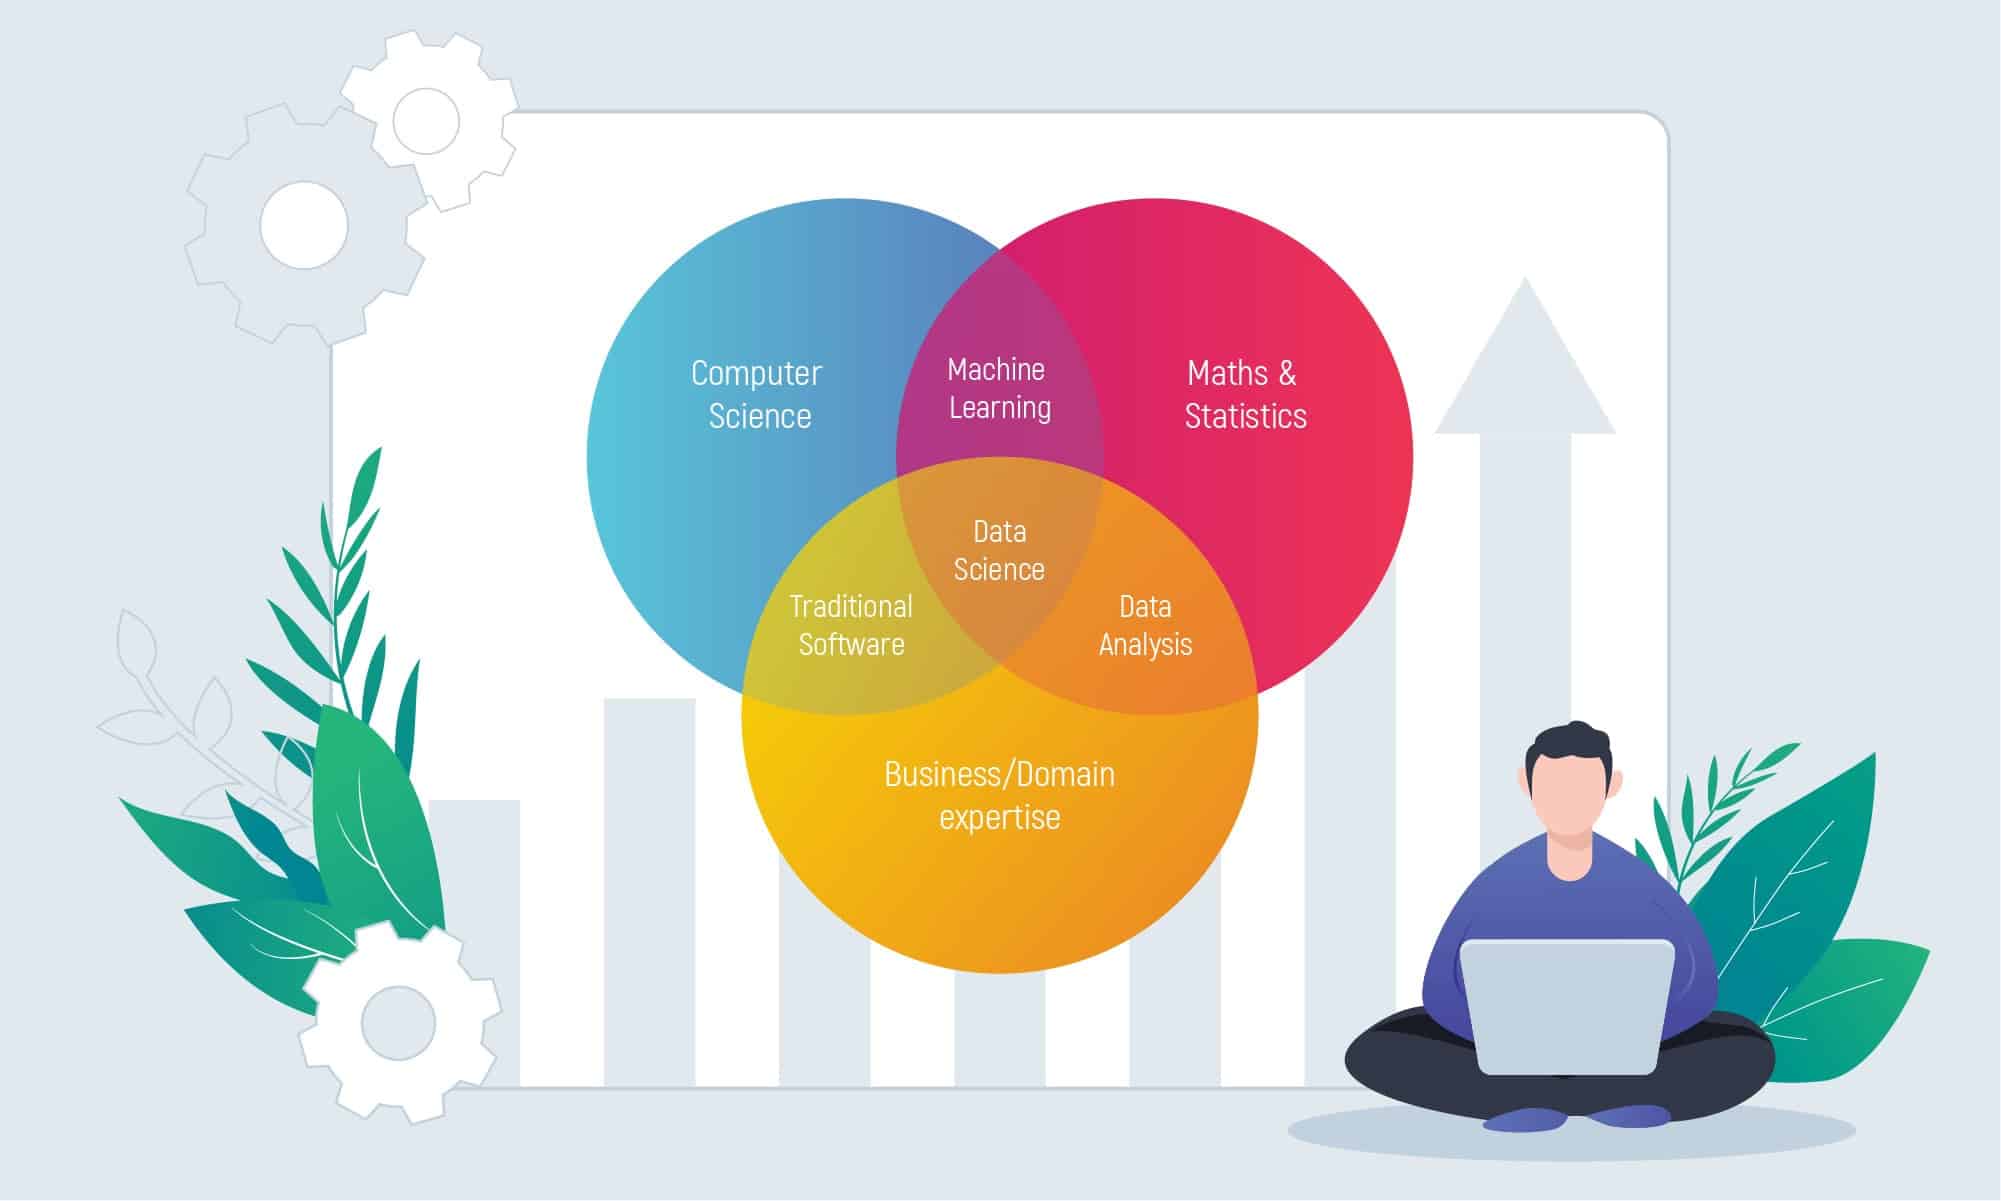
Data Science vs Analytics
Both Data Science and Data Analytics deal with Big Data, but each has its own approach and tools. One of the differences between data analytics and data science is that one analyzes past data and the other predicts future events.
- Data scientists create new processes for data modeling by using prototypes, algorithms, custom analysis, etc.
- Data analysts explore vast data sets to identify trends and create visual presentations to help companies make more thoughtful decisions.
Inoxoft Experience
A few years ago, a business owner in the logistics industry approached us with the request to provide a solution that could resolve the problems with the sales processes, improve service tracking and optimize logistics. While having several vehicles and contracts, the client didn’t have a system to manage and track the processes. Inoxoft team delivered a smart enterprise system that, thanks to various features, synchronization, and connection of internal and external system databases, in particular, rates the contracts, covers the logistics-related fines, schedules the logistic task, improves sales process, etc.
Find out more info about the best data analytics companies in the USA!
Final Thoughts
So, what is data science and analytics and how can you take advantage of them? Doesn’t matter if you desire to create a smart fintech solution, or your need is to develop a smart managing system that will strengthen your business, Inoxoft is here to help you. We offer Big Data analytics services, Machine Learning, Predictive Modeling, and Natural Language Processing to extract useful insights from data and apply effective solutions on a strategic, operational, and tactical level. Contact us to get all the consult our experts!
Frequently Asked Questions
Which is better: data science or data analytics?
These are related concepts but they are being used for different purposes and provide different results. Check our article to know more about how data can help your business.
What is the difference between data analytics and data science?
Data analytics is more specific than data science. The first answers questions for better business decision-making by checking a hypothesis. The second focuses on discovering new questions to drive innovations.
What skills are required for a data scientist?
Data scientists study and interpret vast data sets. This information helps in developing data-driven solutions to satisfy business challenges. So, if you want to be an expert in data science, pay attention to programming languages (R, Python, SLQ, etc.), the process of creating data architectures, machine learning and statistical techniques. Follow the link to the full article to discover more.